
20 Years of Florida Deer Harvest Data: How Check Station Data Can Drive Better Deer Management
by Cody Eggenberger, PhD
Every deer hunter has theories.
Certain WMAs just grow bigger bucks. Particular habitats produce better deer. The moon phase has deer on their feet. And if you've spent enough time around hunting camp, you've probably heard confident arguments for all of them.
But Florida has something that gives us a chance to actually put some of those ideas to the test: decades of deer harvest records.
We've started digging into roughly 20 years of Florida Fish and Wildlife Conservation Commission (FWC) harvest data from public hunting areas across the state. These records include information collected from harvested deer such as age, weight, antler measurements, harvest date, and location. We paired those records with information about the WMAs themselves, including habitat composition, region, acreage, and harvest regulations.
These records are especially interesting to look at now because Florida is transitioning away from staffed check stations and toward electronic harvest reporting. That system can collect a lot of useful information, but some of the detailed measurements recorded at check stations, including most of the antler, age, and weight measurements we're using here, may no longer be collected.
This is our first pass through the data, not the final word on Florida deer by any means, but some interesting patterns are already starting to emerge.
And a few of them surprised us.
Florida bucks appear to be getting bigger antlers
One of the clearest patterns in the dataset is also one of the most encouraging: antler size has increased through time.
To compare bucks, we created an Antler Size Index (ASI) using the measurements recorded at check stations, including number of points, beam length, circumference, and inside spread. This was our way of combining several antler measurements into a single, standardized score that allowed us to compare deer across thousands of harvest records. An ASI of zero represents an average-sized set of antlers across the dataset. Positive values indicate larger-than-average antlers, while negative values indicate smaller-than-average antlers. The farther a buck's ASI falls above or below zero, the more its overall antler measurements differ from the average.
When we looked at average antler size by year, the trend was positive in every FWC region.
The dashed line in the figure marks 2015, when minimum-antler regulations became more widespread. There's plenty more work to do before saying exactly how much of the increase was caused by those regulations. But the overall pattern is hard to miss. Florida hunters today appear to be harvesting larger-antlered bucks than they were 15–20 years ago.
Antler restrictions are not the only change that has occurred in the past 20 years. We have also seen the implementation of area and statewide bag limits, improvements in habitat management through increased prescribed burning, hydrologic restoration, and invasive species management. Furthermore, hunting media focused on public lands have become more prevalent, showing hunters that harvesting larger deer on public lands is possible. Mapping apps have also made accessing and exploring public lands more approachable. It is likely that all of these changes have contributed to the increasing trend in ASI, which may also help explain why a large, immediate increase was not observed following the 2015 antler restriction change.
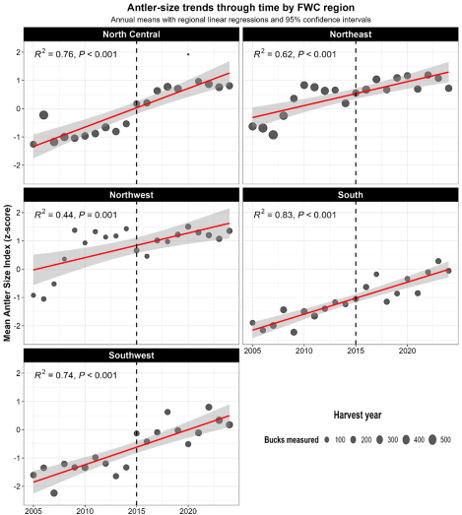
Figure 1. Antler size of harvested bucks through time across Florida's five FWC regions. Points show the average Antler Size Index of bucks measured each year, with larger points representing more bucks in the dataset. The dashed line marks 2015, when minimum-antler restrictions became more widespread. Antler size increased through time in all five regions.
But not all public lands are equal
Anyone who hunts multiple Florida WMAs already knows this intuitively.
Drive an hour or two and you can go from pine flatwoods and palmettos to hardwood hammocks, cypress swamp, marsh, agricultural country, or some mixture of all of the above. Deer living in those landscapes aren't necessarily dealing with the same food, soils, hydroperiods, hunting pressure, or management history.
So we asked another simple question:
After accounting for some of those differences, which WMAs tend to produce bigger-antlered bucks?
This is where things get interesting. Because we don’t want to spot burn, we have changed the names of the WMAs and simply identified the region in which they reside.
The figure below ranks the WMAs by their adjusted antler-size effect. Rather than simply comparing the raw average buck from each property, we used a model to account for some major factors that could otherwise make the comparison misleading including buck age, body weight, year, WMA size, region, and minimum-point restrictions.
That doesn't make this a definitive ranking of the "best deer hunting in Florida." Far from it. Harvest pressure, hunter selectivity, access, season structure, genetics, soils, habitat quality, and plenty of other factors could still matter.
But it does show that meaningful differences among WMAs remain even after accounting for several of the obvious explanations.
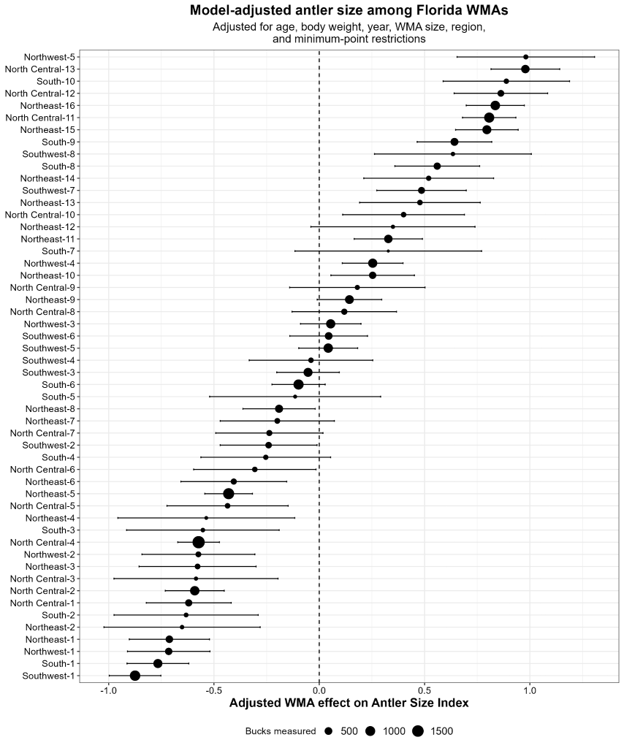
Figure 2. Differences in antler size among Florida WMAs after accounting for buck age, body weight, year, WMA size, region, and minimum-point harvest restrictions. Individual WMA names have been replaced with anonymous region-based identifiers to avoid highlighting specific hunting areas. Values to the right indicate WMAs tending to have larger-antlered bucks harvested than expected, while values to the left indicate smaller-antlered bucks. Point size represents sample size, so larger points represent WMAs where more bucks were measured; horizontal lines show the uncertainty around each estimate. This should not be interpreted as a simple ranking of hunting quality or your odds of killing a big buck. Only WMAs with at least 15 years of check-station data and at least 100 measured bucks were included. Many WMAs did not meet these criteria and are therefore not shown, some of which could have higher or lower ASI values than those depicted here.
One possible piece of the puzzle: Habitat
Once we saw those differences among WMAs, the obvious next question was why?
Habitat seemed like a good place to start.
We combined the many detailed habitat classifications within each WMA into broader habitat types that mean something from a deer-habitat perspective (e.g., flatwoods, hardwoods and hammocks, scrub, freshwater marsh, swamp, agriculture, and so on).
Then we asked whether the percentage coverage of each habitat was related to antler size.
One pattern stood out: WMAs with more swamp habitat tended to have larger-antlered bucks harvested.
Here, “swamp” specifically refers to forested freshwater wetlands such as cypress swamps, dome and basin swamps, floodplain swamps, baygalls, and other forested wetland types. We treated open freshwater marshes and other wetland habitats separately, so this pattern appears to be associated specifically with forested wetlands rather than wetlands in general.
Importantly, that relationship remained even after accounting for buck age and body weight, along with year, region, WMA size, and minimum-point restrictions.
That body-weight piece makes this especially interesting to me. The result isn't simply that swampier WMAs contain heavier deer and heavier deer have bigger antlers. Our model allowed us to account for differences in things like buck age, body weight, year, region, WMA size, and antler-point restrictions, and then ask whether swamp cover was still related to antler size after those other differences were taken into account. It was. In a separate analysis, swamp cover wasn't clearly associated with greater body weight, suggesting there may be more to this relationship than simply bigger-bodied deer growing bigger antlers.
Why?
We don't know yet, and that's where this becomes fun.
Maybe swamp cover is tied to better forage somewhere within the surrounding landscape. Maybe it's a proxy for soils, hydrology, cover, or habitat diversity. Maybe swampier properties provide bucks with more refuge from hunters and natural predators. Or maybe swamp itself isn't the important ingredient at all and is instead pointing us toward some other landscape characteristic we haven't tested yet– soil productivity, hydrology, fragmentation, surrounding land use, or even how those habitats are arranged across the landscape.
For now, the takeaway is not "hunt a swamp and you'll kill a giant."
It's that something about WMAs with greater swamp coverage appears to be associated with larger antlers, and that's a lead worth following.
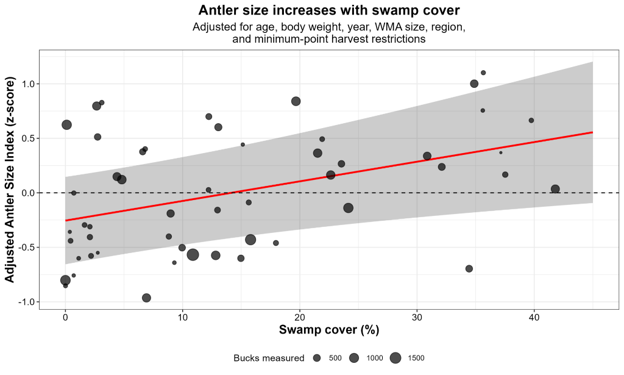
Figure 3. Relationship between swamp habitat and antler size across Florida WMAs. The line shows the estimated relationship after accounting for buck age, body weight, year, WMA size, region, and minimum-point restrictions. Each point represents a WMA and shows how its antler measurements differed from the overall model prediction after accounting for those factors. This allows for a more reasonable comparison among WMAs than simply comparing their raw average antler measurements. Larger points indicate WMAs with more bucks in the dataset. The variation among points shows that swamp cover is only one piece of the puzzle. Some WMAs produced larger or smaller antlers than their habitat composition alone would predict. Importantly, the relationship wasn't being driven by a single WMA and the trend remained positive when we removed each WMA and reran the analysis. In our final model, a 10-percent increase in swamp cover was associated with a 0.18 increase in ASI (about 1/5th of a standard deviation in antler size).
A first look, not the final answer
There are some important limitations to keep in mind with all of this.
These are harvested deer, not a random sample of every deer walking around Florida. Hunters decide which deer to shoot. Regulations influence which deer can legally be harvested. Different WMAs receive very different amounts of hunting pressure. To avoid drawing conclusions from areas with limited data, we restricted this analysis to WMAs with at least 15 years of check-station records and at least 100 bucks measured. Even within those WMAs, however, the amount of data available varies considerably among properties and years. Habitat categories tell us what's available across an entire WMA, not necessarily what an individual buck actually used.
And check-station data collected over two decades inevitably contain missing measurements, inconsistent reporting, and other imperfections.
We tried to account for some of the biggest issues where we could, but no statistical model magically removes all of them.
That's why we'd treat these results as clues rather than conclusions.
And that's also why this dataset is so valuable.
We're gaining convenience, but what data are we losing?
Florida deer harvest reporting is changing.
FWC's move away from staffed check stations and toward electronic harvest reporting makes plenty of sense from a practical standpoint. Electronic reporting is faster, cheaper, and much easier to implement statewide than paying people to physically staff check stations.
But there's a tradeoff that deserves attention.
A hunter can report that he or she killed an 8-point buck. That's useful information. But as you know, two 8-pointers can be dramatically different animals.
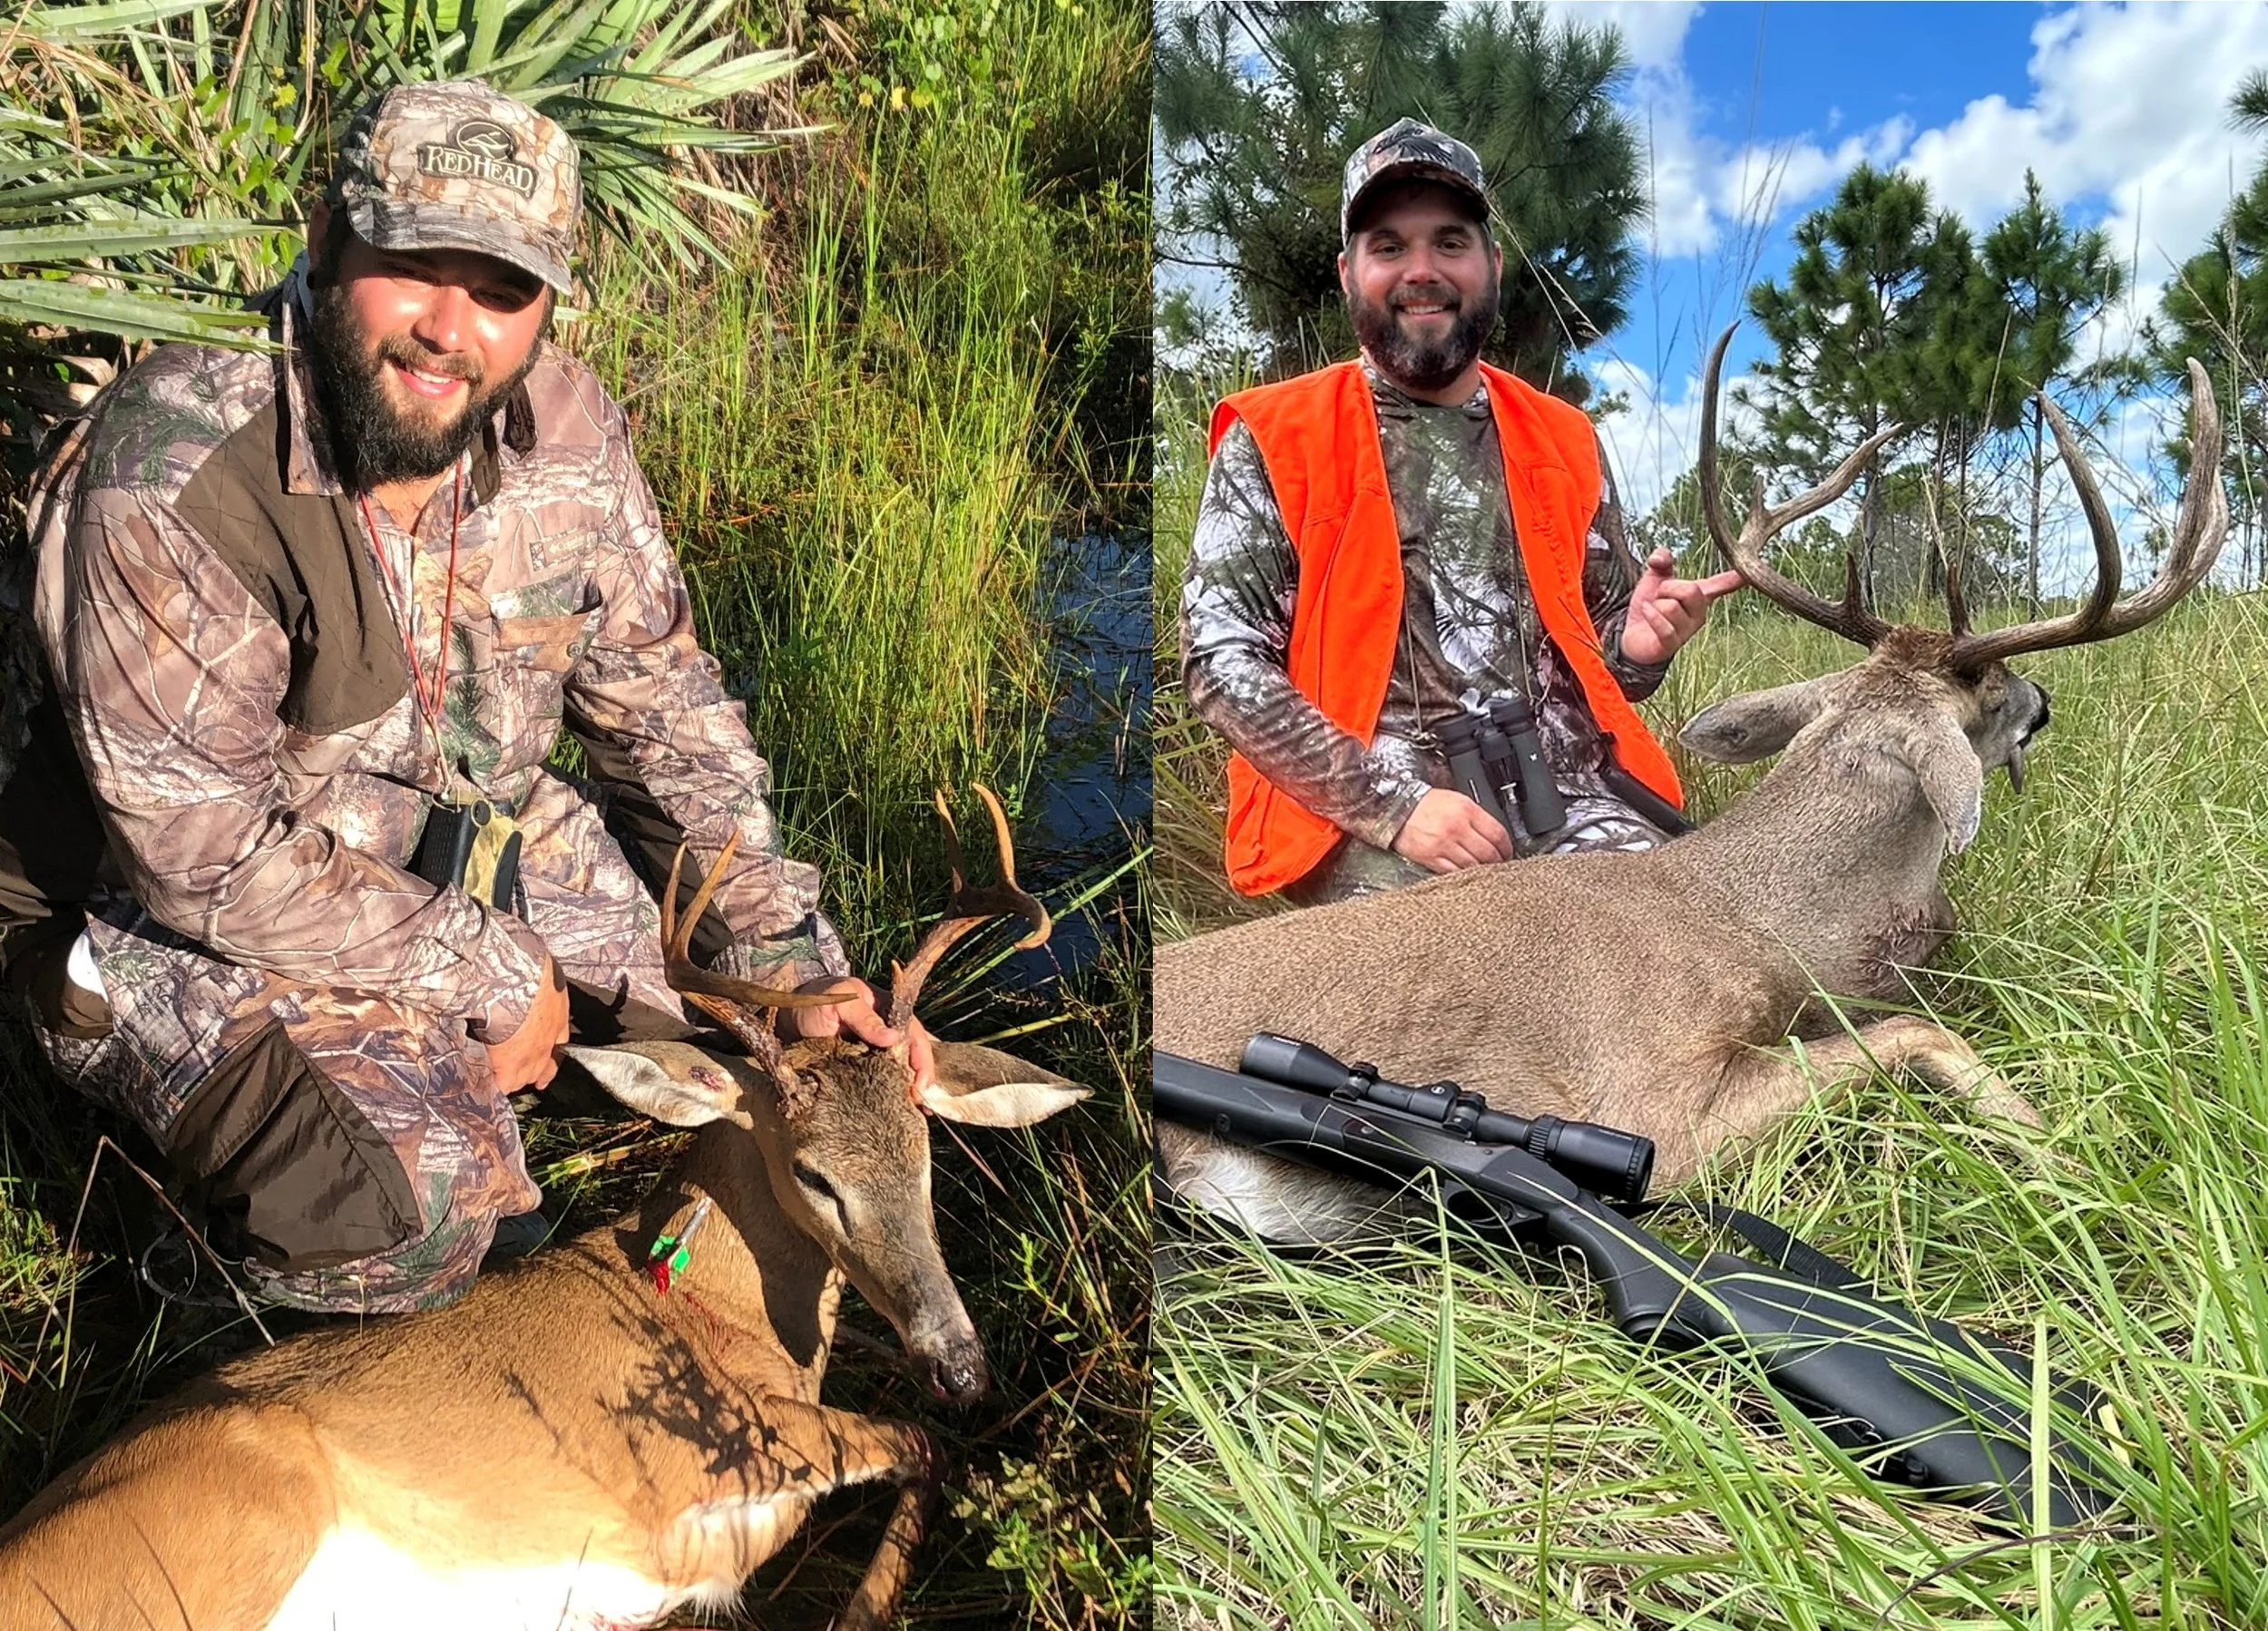
Figure 4. Not all 8-points are created equal. Both of these bucks would simply be recorded as 8-points under a point-count-only reporting system, despite the obvious difference in overall antler size. Photos courtesy of our President, Mark Barton.
At a check station, a deer can provide much richer information: age, body weight, beam length, antler circumference, inside spread, number of points, and potentially biological samples. Those measurements are what allow us, years later, to ask questions that nobody may have been thinking about when the deer was originally checked.
If we stop collecting them, we can't go back and recreate them.
There may be a middle ground.
One possibility worth exploring would be incorporating photos or short videos into electronic harvest reporting. As computer-vision and AI tools improve, standardized images may eventually allow wildlife agencies to estimate antler measurements, or perhaps other characteristics, without requiring someone to physically measure every deer at a check station.
That wouldn't necessarily replace traditional biological sampling, and such a system would need to be carefully tested for accuracy. But even a standardized photo archive could create a valuable dataset for questions we haven't thought to ask yet.
The important point isn't that every hunter needs to become a data collector.
It's that good harvest records become more valuable with time.
The graphs above exist because someone measured these deer years ago.
Where we go next
We've barely scratched the surface of this dataset.
One of the next questions we’re interested in is digging deeper into what actually makes a WMA capable of producing bigger bucks. Swamp habitat gave us one clue, but there are plenty of others to investigate.
Doe harvest may give us another useful angle. Unlike antler size, female body weight and condition may provide a more direct window into differences in habitat quality and landscape productivity, although factors such as age, reproductive status, weather, and deer density also influence body condition (Simard et al., 2014, Turner et al., 2024). Just as importantly for our dataset, does aren't subject to the same antler regulations or hunter selection for antler size that complicate comparisons among bucks.
There are also plenty of hunting questions still sitting in these records. We can take a much closer look at the moon, rut timing, weather, age structure, regional differences, regulation changes, and how all of those factors interact.
For now, though, our first trip through roughly two decades of Florida deer records has already produced a few good takeaways:
Florida hunters are harvesting larger-antlered bucks than they were 20 years ago– A positive trend that has occurred alongside major changes in deer and habitat management across the state.
Where you hunt matters– Some public lands consistently produce larger-antlered bucks than others, and understanding why could help inform future habitat and deer management.
Swamp habitat may be part of the equation– Understanding why bucks associated with swamp habitats tend to have larger antlers could provide insight into how hydrologic restoration and other landscape changes may shape Florida’s deer herd.
There’s a lot more digging to do, and we’re looking forward to seeing what else we can pull out of these records.
But data and statistics aside, there’s still no substitute for putting boots on the ground. A graph might give you a clue about what kind of habitat to look at, but it won’t tell you where that buck beds, which trail he uses when the wind switches, or where you need to be when daylight breaks on opening morning. We’ve been doing plenty of scouting ourselves, and with zone-C opener right around the corner, we’re ready to trade the computer screen for the woods.
Good luck this season. Safe and happy hunting!
References
Simard, M. A., Huot, J., de Bellefeuille, S., & Côté, S. D. (2014). Influences of habitat composition, plant phenology, and population density on autumn indices of body condition in a northern white-tailed deer population. Wildlife Monographs, 187, 1–28. DOI: 10.1002/wmon.1010.
Turner, M. A., Harper, C. A., Strickland, B. K., Lashley, M. A., Wilber, M. Q., & McKinley, W. (2024). Correlating male white‐tailed deer antler size with female body mass across multiple spatial scales. The Journal of Wildlife Management, 88(7), e22626.
